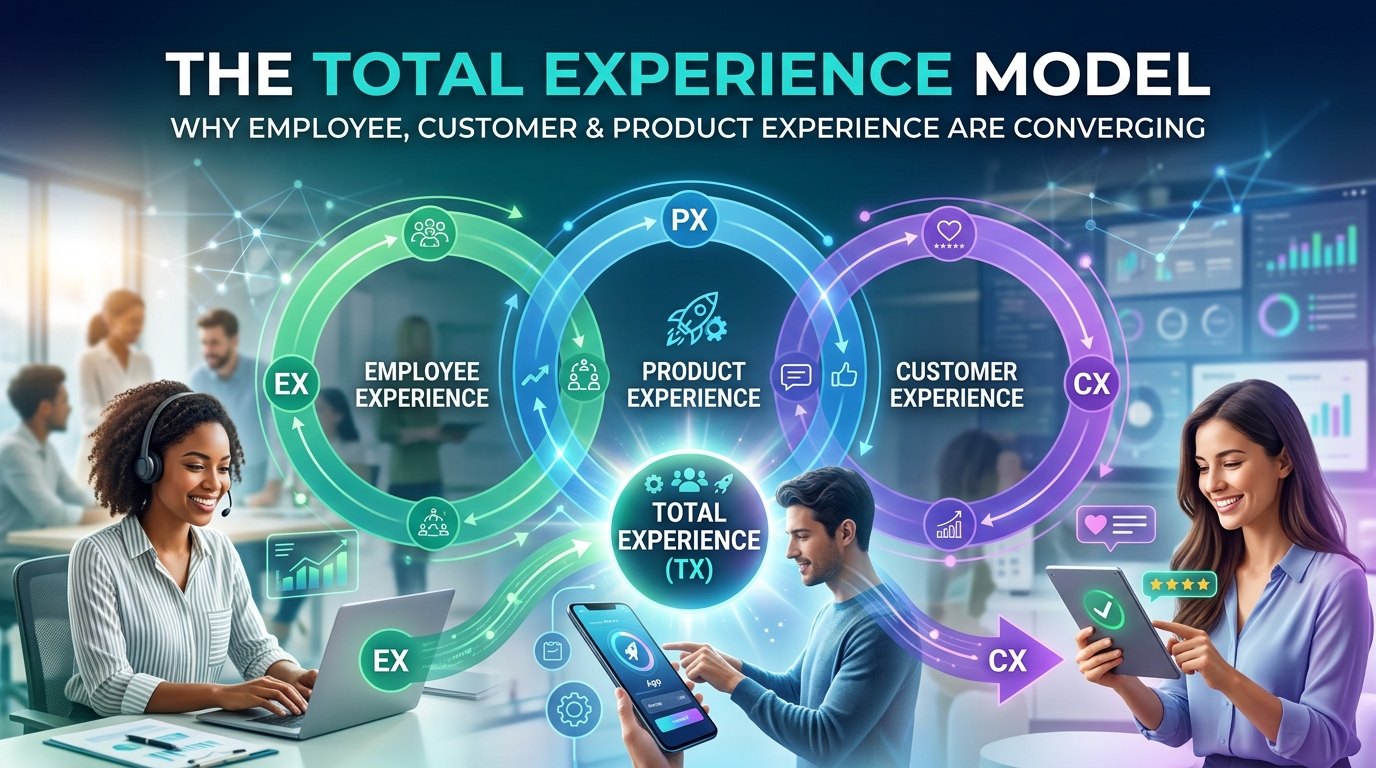
Three Experiences, One System
For most of the last decade, the disciplines of Employee Experience (EX), Customer Experience (CX), and Product Experience (PX) have been managed separately — by HR, by customer success/support, and by product teams respectively. Each had its own metrics, its own tooling, its own budget cycle.
That separation is breaking down. And the teams that recognize this early are building durable competitive advantage.
The Case for Convergence
The Same Friction Shows Up Everywhere
A product bug that confuses customers almost always also frustrates support agents — they field the escalations. A broken internal tool that makes agents’ jobs harder produces worse customer outcomes — slower responses, more errors, lower CSAT. Poor product documentation hurts both the customer trying to self-serve and the new agent trying to learn the product.
The insight: employee friction and customer friction are often the same problem, seen from different angles.
AI Has Made the Handoffs Visible
AI support tools have an unexpected side effect: they surface the gaps between experiences very clearly. When an AI fails to answer a customer question accurately, the root cause is usually one of:
- Missing or incorrect KB content (PX/documentation gap)
- Ambiguous product behavior that agents themselves don’t understand (EX gap)
- A customer expectation misaligned with actual product capability (CX gap)
Before AI, these gaps were masked by human agents who compensated through tacit knowledge, workarounds, and heroics. AI can’t compensate — it surfaces the gap explicitly.
Customers Can Tell When Teams Are Misaligned
Customer research consistently shows that customers experience internal organizational dysfunction as bad service. When the sales team promises something the product doesn’t do, when the support agent contradicts the KB article the customer already read, when the billing team has no record of the upgrade the customer paid for — these aren’t individual failures, they’re alignment failures.
Customers don’t see your org chart. They see one company.
What Total Experience Looks Like in Practice
Shared Metrics
Traditional:
- EX: eNPS, agent satisfaction, onboarding time-to-productivity
- CX: CSAT, NPS, first response time, resolution rate
- PX: adoption rate, feature engagement, time-to-value
Total Experience (TX) adds cross-cutting metrics:
- Friction Index: the ratio of support contacts to product actions (how often does doing X in the product generate a support ticket?)
- Agent Confidence Score: how often do agents override AI suggestions? High override rate signals KB or product documentation gaps
- Experience Delta: CSAT on issues resolved by AI vs. human vs. self-serve — difference signals where experience is weakest
Product Decisions Made With Support Data
In TX-mature organizations, the support ticket queue is a product input. Not just via occasional “voice of customer” reports, but as a real-time data stream that informs sprint planning.
One mid-market SaaS company we work with routes categorized ticket data directly to their product analytics dashboard. When a specific feature generates > 3% of weekly tickets for 3 consecutive weeks, it automatically generates a product investigation ticket.
Internal Tools Treated as Products
Agent tooling — the CRM, the KB, the ticketing system — is a product too. It has users (agents), UX, performance, and adoption metrics. TX-mature teams apply the same product thinking to internal tools: user research with agents, usability testing, iteration cycles.
The business case is straightforward. If an agent can resolve a ticket 40 seconds faster because the CRM surface is better, and they handle 50 tickets per day, that’s 33 minutes per agent per day of recovered capacity. At 100 agents, that’s 55 agent-hours per day.
Shared Roadmap Sessions
The highest maturity indicator we’ve seen: quarterly sessions where CX, Product, and HR leaders review all three experience data streams together and identify shared problems. These aren’t status updates — they’re problem-definition sessions.
One VP of Product at a logistics software company told us: “The hour I spend with the CX team every quarter saves me about 40 hours of rework. They know what’s broken in ways that product analytics can’t tell you.”
The Resistance
Convergence is resisted, often unconsciously, because:
- Budget protection: if we share metrics, how do we measure my team’s contribution?
- Attribution conflict: who gets credit when a product fix reduces support tickets?
- Tooling lock-in: different teams have deeply integrated different platforms
These are real obstacles. TX implementation typically takes 12-18 months even in supportive organizations. The teams that get there fastest appoint a single executive owner of the initiative with cross-functional authority — usually CX reporting to a COO or CEO, not to CS/Support.
Where to Start
Month 1: Map the five highest-volume customer issues. For each, identify: what product behavior causes it, what documentation explains it, what training agents have on it. Find the gaps.
Month 2: Share that map with Product and with People/HR. Schedule a joint session. Don’t have an agenda beyond “here’s what we found.”
Month 3: Agree on one shared metric to track together. Friction Index is a good starting point because it’s owned by no team in particular and benefits everyone to reduce.
The goal isn’t an org restructure. It’s enough shared visibility that misaligned decisions get caught before they become customer problems.